- AWS EC2—See Viewing Cloud Optimization Reports
- AWS Auto Scaling Groups—See Working with Auto Scaling Groups
- Azure Virtual Machines—See Viewing Cloud Optimization Reports
- GCP Compute Engine—See Viewing Cloud Optimization Reports
Table: Public Cloud Optimization Tabular Report
Table: Public Cloud Optimization Tabular Report
Component / Column Name | Description | ||||||
|---|---|---|---|---|---|---|---|
The number of instances listed in this column is a hyperlink that takes you to the Instance Optimization Details page for the selected group. For more information, see | |||||||
Identifies the overall status of the optimization results based on the Optimization Type and potential $ Savings/Month:
| |||||||
The recommended type for the group of instances. See | |||||||
The current catalog instance is listed. This value is based on the data collected. | |||||||
This is the recommended catalog instance, based on optimization analysis. | |||||||
Recommended Purchasing Strategy | This column is no longer used. | ||||||
Defer recommendations until reserved instance coverage for this group expires. Values include:
This field is based on AWS Defer Recommendation settings. | |||||||
RI data is no longer collected and this column is no longer in use. | |||||||
The current estimated cost is determined by adding all the current estimated cost of each instance in the group. See | |||||||
Recommended Estimated Cost ($) | The recommended estimated cost is calculated by adding all the recommended estimated cost of each instance in the group. See | ||||||
The estimated current and recommended instance cost is used to calculate savings per month (i.e. current estimated cost - recommended estimated cost). | |||||||
[ High | Medium | Low | None ] This column describes the effort required to investigate and implement the Densify recommendations. The displayed group effort is an average of all the calculated efforts for each instance (or service) in the group. Effort for each instance is calculated by rule-driven analytics based on factors (such as family change, storage change, data quality checks, feature changes, etc.) that can be configured in the policy settings and rule set which captures best practices. | |||||||
The current value for CPU allocation. | |||||||
Recommended vCPUs | The recommended value for CPU allocation. | ||||||
The current value memory altion. | |||||||
Recommended Memory Allocation (GB) | The recommended value for memory allocation. | ||||||
A footnote at the bottom of the optimization opportunity report displays the total number of instances (subject to any guest filters applied) of the specific public cloud service type. The number of instances is a link to the Instance Optimization Details page, showing an aggregate report that contains all recommendations of that service type in one view. For details on this page, see Note: If recommendation filters are applied, the total number of instances on the last page of the optimization report might not be the same as the total number of instances in the footnote; this is because the recommendation filters are not reflected in the footnote total. | |||||||
Sort By | You can change the instance group order of the tabular optimization opportunity report by selecting one of the sort options in the top Sort By dropdown list. For details on sorting behavior, see Sorting Options. Note: If there is no data in the optimization opportunity tabular report, the Sort By section is not displayed. | ||||||
In the top-right corner of tabular optimization opportunity reports, the total number of Instances and the Savings/Month for implementing the recommendations are displayed. The total number of instances displayed is a total of all the analyzed instances with guest and recommendation filters applied. The amount of savings per month is based on filtered data and can be negative if there is higher upsizing cost. Note: If there is no data in the optimization opportunity tabular report, the Summary Total section is not displayed. |
Filtering Options
You can filter the optimization opportunity reports by guests and instance attributes, as well as by recommendations.Figure: Accessing Filter Options
Figure: Accessing Filter Options
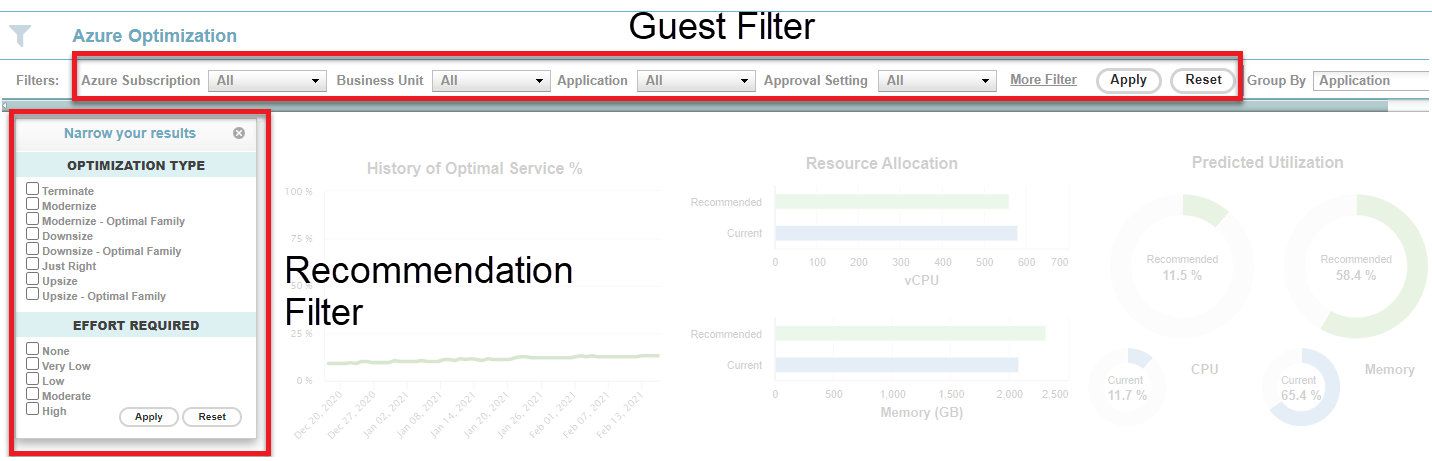
Filtering by Guest Attributes
You can filter instances using a set of attributes (e.g. Business Unit, Application). This type of filtering is supported on the optimization opportunities dashboard tabs, as well as the Instance Optimization Details page when navigating from the Count column. The guest filters selected are persistent across platforms for those pages that support the guest filters (i.e. guest filters selected for AWS EC2 will apply to the AWS RDS, as well as the AWS Instance Optimization Details reports). For details, see Using the Guest Filter.Filtering by Recommendation
You can filter instances based on recommendations using the Recommendation Filter Menu. This filter allows you to narrow the results of your optimization reports based on recommended optimization type, effort required, monetary impact, and service characteristics. The resulting filtered report can be exported for external analysis using the Export to Excel (
Sorting Options
Optimization opportunity reports in tabular format can be sorted by the following fields:- Overall Status & Optimization Type (default option)
- $ Savings/Month High to Low
- $ Savings/Month Low to High
- Effort None to Moderate
- Effort Moderate to None
- Current RI Expiry Date
Table: Sorting Option Descriptions
Table: Sorting Option Descriptions
Sort Options | Description |
|---|---|
Overall Status & Optimization Type (default) | By default, the tabular optimization opportunity reports are ordered based on this option. Instances are first sorted by Overall Status, in the following order:
If the overall status is the same, then the secondary sort key is Optimization Type, in the following order:
If overall status and optimization types are the same for the instances, then the tertiary sort key is by instance Count, in descending order. |
$ Savings/Month High to Low | Sort by the $ Savings/Month field, from largest savings to lowest savings. If the savings are the same, then secondary sort is performed on Effort, from None to High. |
$ Savings/Month Low to High | Sort by the $ Savings/Month field, from lowest savings to largest savings. If the savings are the same, then secondary sort is performed on Effort, from None to High. |
Sort by Effort, from None to High. If the effort is the same, then secondary sort is performed on $ Savings/Month, from largest savings to lowest savings. | |
Sort by Effort, from High to None. If the effort is the same, then secondary sort is performed on $ Savings/Month, from largest savings to lowest savings. | |
Current RI Expiry Date | Sort from earliest to latest date. Instance groups with no RI expiry dates are displayed at the end of the list. |