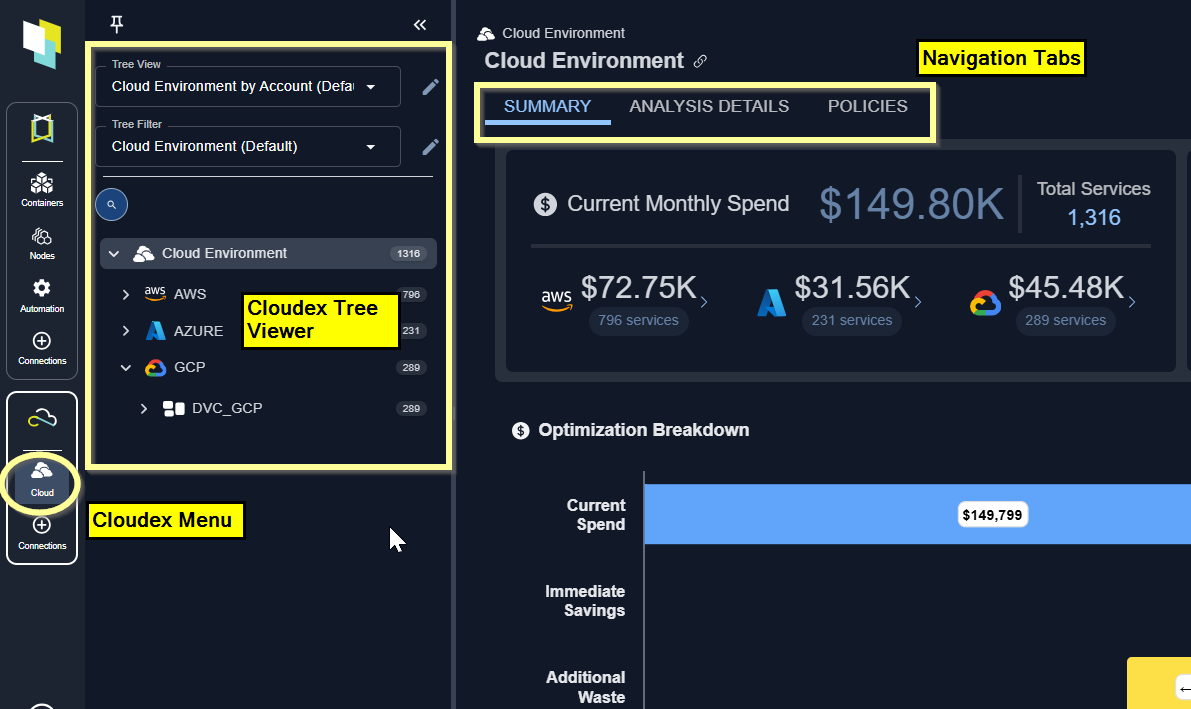
Figure: Locating the Tree Viewer


Use the container tree viewer to navigate your container environment.

Use the node tree viewer to navigate node groups supporting your container environments.
Hiding the Tree Viewer
Once you have selected the scope of systems to review you can hide the tree viewer. If you are working on a smaller screen or laptop it will be easier to view tables and charts with the increased screen space.
By default, the tree view is pinned to the left side of the screen.
When the viewer is pinned, click the chevrons to open/close the tree viewer.

Click the pin to hide the tree viewer.
Use the

Views and Filters
The default view is your container hierarchy i.e. Cloud Provider > Cluster> Region> Service > Instance. This view can be customized to better manage your data. See Creating Custom Views. You can also create customized filters to manage large sets of data. See Creating Custom Filters.Navigating the Tree Viewer
The following icons are available, by default. You can create custom views based on other attributes that may not include any of the following items.Table: Tree Viewer Icons
Table: Tree Viewer Icons
| Icon | Entity | Description |
|---|---|---|
 | Cloud Environment | The top level entity that contains your cloud infrastructure. |
 | Region | This represents a region. The region is the geographic location where your public cloud resources are located. |
   | Service Type | This represents the type of service. Currently Cloudex supports:
|
   | Provider | This represents your public cloud provider. Currently Cloudex supports AWS, Azure and GCP. |
 | Instance | This represents an individual instance. |
 | Other Grouping | Represents other attributes or labels that have been used to group the data. |
Instance Counts
You can see a count of the number of instances at each branch of the tree viewer. When counts are very large, consider creating a view or a filter to more efficiently view your systems.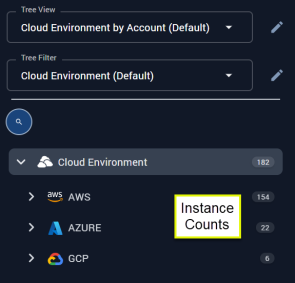
Figure: Instance Counts
Using the Tabs
Based on your selection in the tree viewer various tabs are displayed to view the selected data. When multiple systems are selected you see:- Summary—Shows you a summary of how effectively your resources are being utilized.
- Analysis Details—Shows analysis details of the selected scope of your environment in various tabular views with utilization charts for a selected system.
- Overview—Shows you the utilization and recommendation details for the selected instance.
- Catalog Map—Shows you collected and analyzed data for the selected instance.
Video Resources
Searching for a System
Searching for a System
Using the Tree Viewer
Using the Tree Viewer