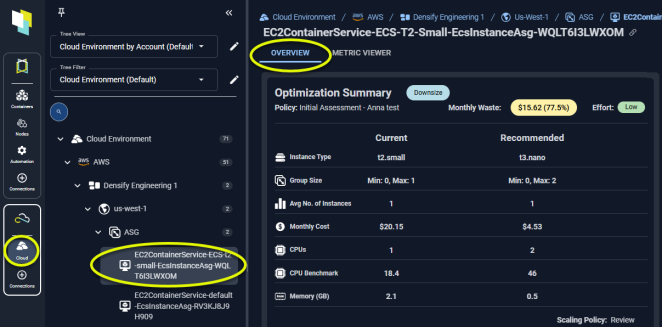
Figure: Locating the Overview Tab
Impact Analysis and Recommendation Report
The Impact Analysis and Recommendation report provides a PDF version of the instance details. You can easily share this report with the application owner to share your proposed sizing recommendations. You can also share the link.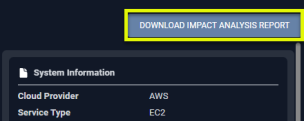
Figure: Generating the Report
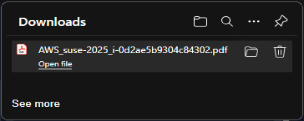
Figure: Downloading the PDF
Note: This report is not available for Azure VM Scale Sets.
When you click the button, a popup opens with a link. You can save or download the file.
The filename will be
<cloud provider>_<system name>_<system_id>.pdfOptimization Summary
Hover over any of the listed items to see a brief description. Complete descriptions of each setting are provided in the Analysis Details Table.Optimization Summary - Single VM Instances
Instance details and key metrics are displayed for the current and recommended instance types.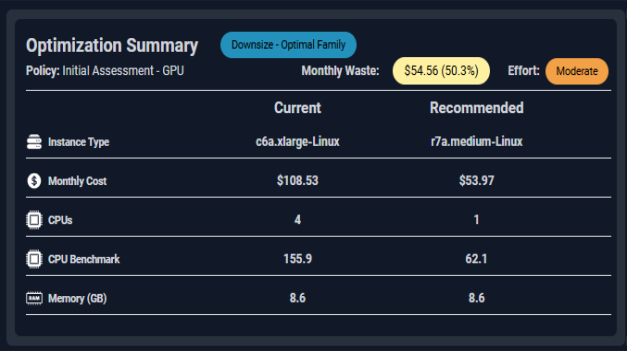
Figure: Optimization Summary - Single VM Instance
Optimization Summary Block - Single Scale Set
Instance details and key metrics are displayed for the current and recommended instance types for a scale set.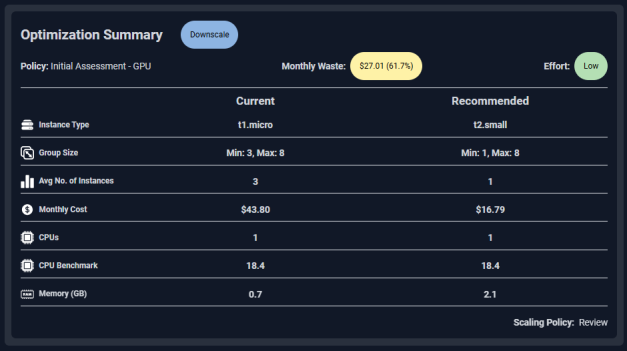
Figure: Optimization Summary - Single Instance
System Details
This card summarizes the identification details for the selected instance. The same details are provided for a single VM or scale set.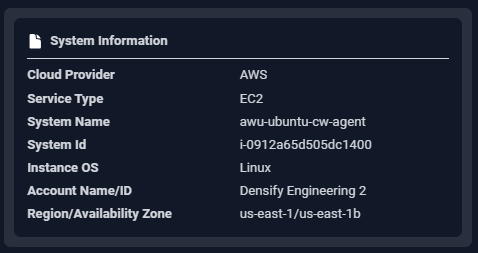
Figure: System Details
Status Overview
This card summarizes the status of this instance within Cloudex.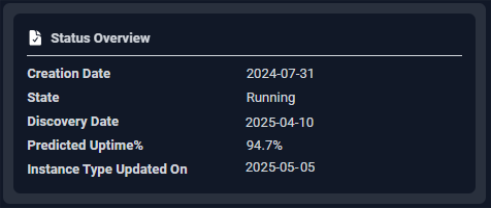
Figure: Status Overview
Utilization Charts
The bottom section shows the utilization charts for the selected instance. These charts show hourly min/max and sustained activity for the selected system. The charts show the current and the recommended settings for selected workloads. If the selected instance is “Just Right” then there are no charts for the recommended instance type. See Analysis Details Utilization Charts for details on using these charts to review workload data.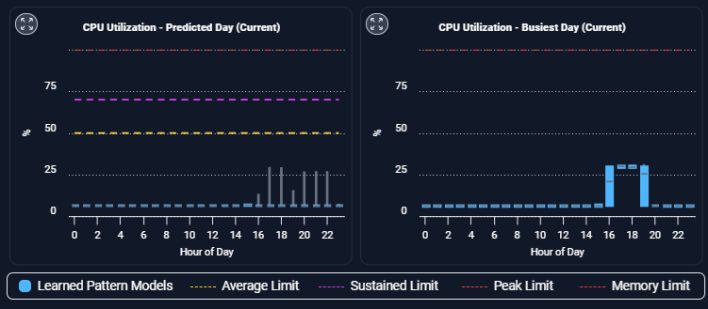
Figure: Utilization Charts
- CPU Utilization ()
- CPU Utilization - Busiest Day
- Memory Utilization
- In Service Instances (for ASG and VMSS only)
- Network I/O Bytes
- Network I/O Packets
Expanded Modal View
You can also expand any chart to the modal view and select from the following options for review.
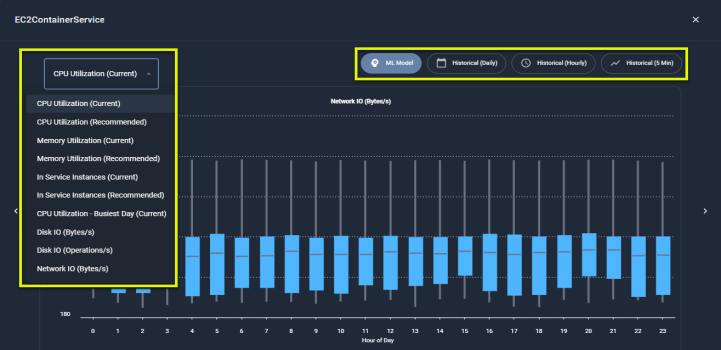
Figure: Chart Modal View
Video Resources
Using the Tree Viewer
Using the Tree Viewer
Using the Utilization Charts
Using the Utilization Charts