
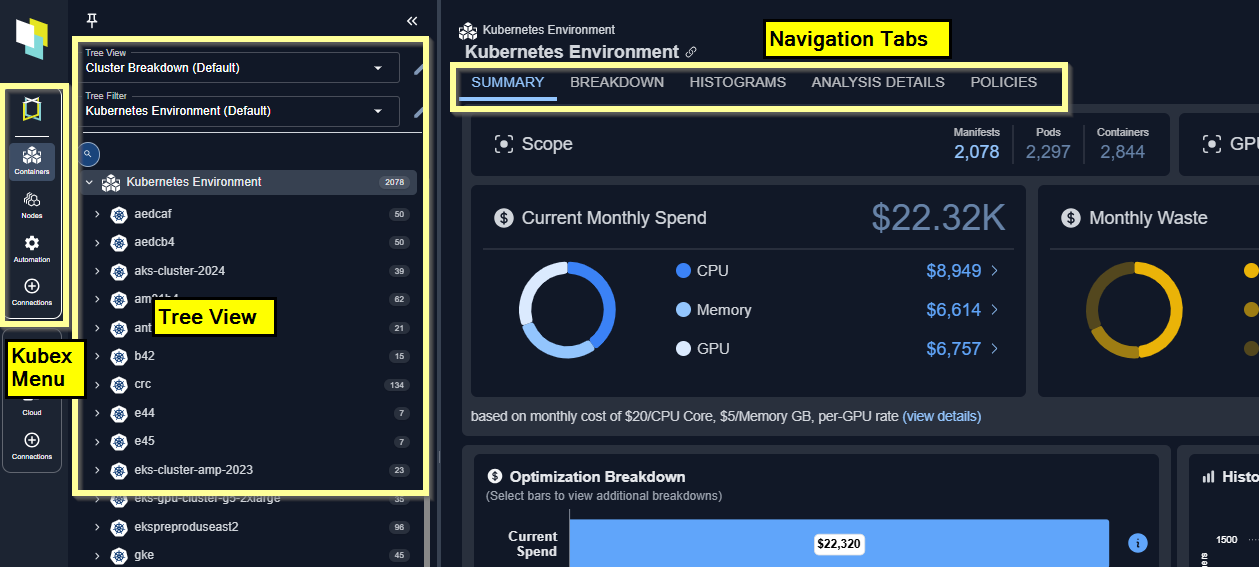
Figure: Container Analysis
- Summary —Shows you a summary of how effectively your resources are being utilized.
- Breakdown —Shows you a breakdown of the items, selected in the tree view. Systems at risk and those with wasted resources are clearly indicated.
- Histograms —Shows you the selected scope of your environment as a set of histograms.
- Analysis Details —Shows analysis details of the selected scope of your environment in various tabular views with utilization charts for selected systems.
- Policy —Shows all the analysis policies used by the selected scope of containers.
- Overview —Shows you an overview of the selected container manifest.
- Metrics Viewer —Provides detailed metrics for the selected container manifest.
- GPU —This tab appears when a single container manifest with GPU resources is selected.
- Policy —Shows the analysis policy used by the selected container manifest.
- Automation —Shows the automation state for the selected container manifest.
Video Resources
Kubex UI Overview
Kubex UI Overview
Using Histograms
Using Histograms
Using the Tree Viewer
Using the Tree Viewer