Table: Histogram Chart Selection Controls
Table: Histogram Chart Selection Controls
| Control | Description |
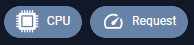
 | Select whether you want to review CPU, memory or both CPU and memory. |
 | Select whether you want to review request values, limit values or both requests and limits. |
 | Unspecified—You can indicate whether or not to include containers with unspecified values.When enabled, the grey bar indicates the number of containers with unspecified values. If, for example, both the CPU Request and Limit values are unspecified for a container manifest, this will contribute to the unspecified count in both the CPU Request and CPU Limit charts. If only the CPU Limit value is unspecified then only the unspecified count on the CPU Limit chart is incremented. |
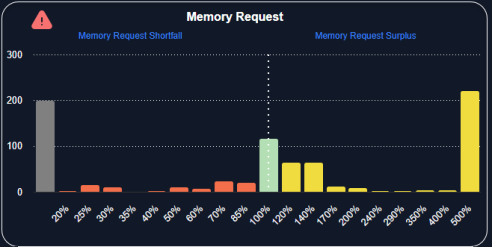
Figure: Memory Request Chart
Histogram Charts
These histogram charts show your select data grouped as a distribution. The scope of data, is defined by the tree viewer. Based on Densify’s analysis of your container environments, sizing recommendations are generated and the container is determined to be at risk, just right or oversized. Each container manifest is then placed into a “bucket”, based on how close its allocation is from the optimal configuration. The histogram shows you how many containers/pods (Y-axis) are in each of these buckets that are displayed along the X-axis. The current resource allocation, as a percentage of what is actually required, make up these buckets on the X-axis. The data is shown on the chart as follows:- Containers identified with less than optimal resource allocation (shortfall) are identified as having between 0 and 99% of their optimal allocation (Current Resources as a percentage of required < 100%). These containers are shown on the left side of the chart.
- Containers with all of the resources they need are indicated as 100%, or no sizing error.
- Containers with surplus resources are identified as having over 100% of their optimal allocation (Current Resources as a percentage of required >100%). These containers are shown on the right side of the chart and highlight stranded resources that are committed to pods that are not using them.
- If you have enabled Show > Unspecified, then the number of containers with an unspecified resource request and/or limit value are also shown at the far left of the chart.
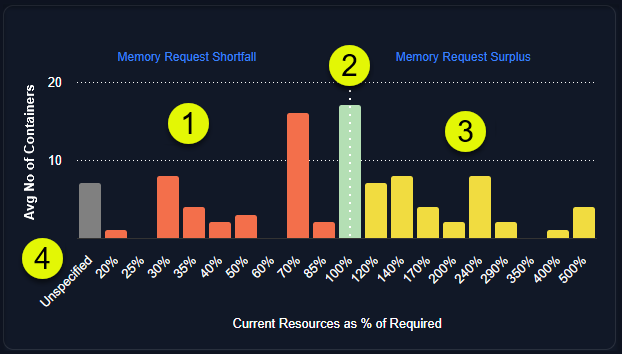
Figure: Histogram Chart
Additional Features
Use the following additional features on these charts to see the recommendation details:- Drill down hyperlinks—The zone names are hyperlinks that take you to the Analysis Details tab, with the corresponding Table View selected, showing the relevant systems. For example, if you click “Throttled CPU Risk”, Kubex switches to the Analysis Details tab with the “CPU Request Shortfall” view selected.
- Hover-over details—When reviewing the charts, you can hover over any of the bars to see how many containers are in the selected bucket.
- Warning Indicators—A warning indicator is displayed on the chart if memory events have occurred in the selected scope of systems. Click the message to see the corresponding detailed view on the Analysis Details tab.
- Savings Indicators—Another indicator is displayed on the chart if resource allocations can be adjusted to save money. Again, you can click the message to see the corresponding detailed view on the Analysis Details tab.
Analysis Details Tab - Memory Request Shortfall View
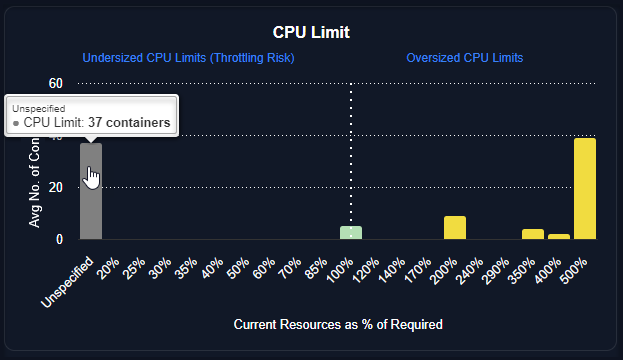
Figure: Histogram Hover-Over
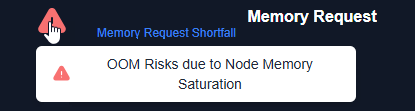
Figure: Visual Indicator
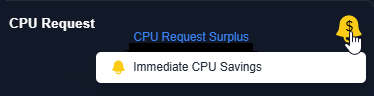
Figure: Visual Indicator
CPU Request
CPU Limit
Memory Request

Memory Limit
Video Resources
Searching for a System
Searching for a System
Using Histograms
Using Histograms
Using the Tree Viewer
Using the Tree Viewer