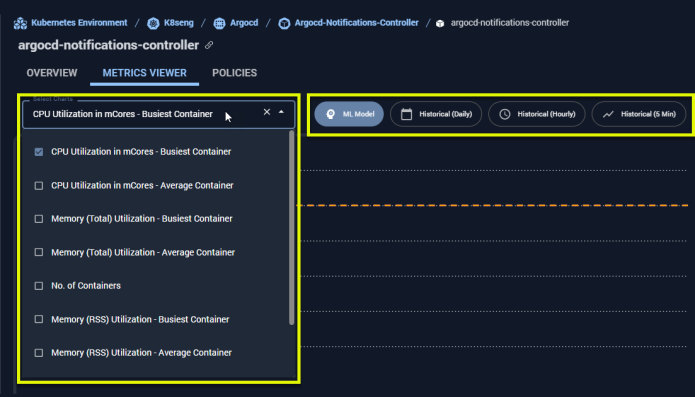
- Select one container to review. The metrics viewer tab is not displayed until only one container is selected.
- Use the tree viewer’s search feature to find a specific container. Enter the name of the container, as you type, matching items are displayed in the list.
- Ensure the view and filter settings are set accordingly, to locate your specific container.

Figure: Locating the Metrics Viewer
Metrics Viewer Controls
When you open the metrics viewer, the instance that was selected in the Instance Optimization Details page is displayed. You can from the tree viewer, or from the Analysis Details tab. You can configure the data you want to view for this container using the options in the dropdown menus.
Figure: Configuring the Metrics Viewer

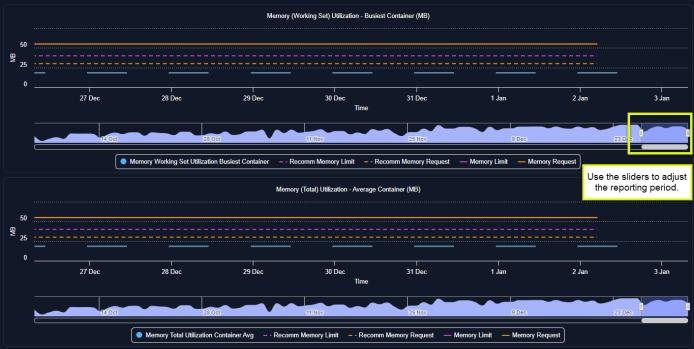
Figure: Configuring the Metrics Viewer
Table: Metrics Viewer Controls
Table: Metrics Viewer Controls
- CPU and memory request and limit values are shown as straight lines.
- Tool tip indicating specific values on the selected date or hour.
- Legend - See 1 .
Available Container Metrics
The following table lists the complete set of metrics that you can review in the metrics viewer.Table: Container Metrics
Table: Container Metrics
| Metrics | Units |
|---|---|
| CPU Limit - Current | mCores |
| CPU Limit - Recommended | mCores |
| CPU Request - Current | mCores |
| CPU Request - Recommended | mCores |
| CPU Utilization - Busiest Container | mCores |
| CPU Utilization - Container Average | mCores |
| Disk I/O - Busiest Container * | Kbytes/s |
| Memory (RSS) Utilization - Busiest Container | MB |
| Memory (RSS) Utilization - Container Average | MB |
| Memory (Total) Utilization - Busiest Container | MB |
| Memory (Total) Utilization - Container Average | MB |
| Memory (Working Set) Utilization - Busiest Container | MB |
| Memory (Working Set) Utilization - Container Average | MB |
| Memory Limit - Current | MB |
| Memory Limit - Recommended | MB |
| Memory Request - Current | MB |
| Memory Request - Recommended | MB |
| No. of Containers | Number |
| No. of Restarts | Number |
