Figure: Locating the Node Group Overview
Analysis Summary
Click on any of the listed settings to see a brief description. Complete descriptions of each setting are provided in the Node Group Analysis Tab tab. Identifying details and the recommendation are displayed on this card.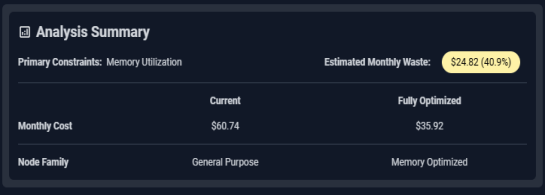
Figure: Analysis Summary Details
Node Group Information
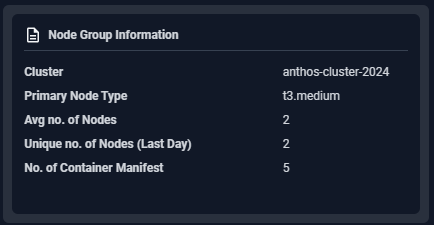
Figure: Node Group Information
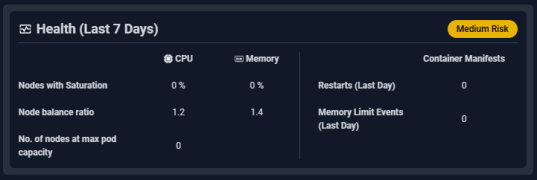
Figure: Node Group Health Details

The node group is considered low risk if both CPU and memory saturation are 0 and there are no memory limit events.

The node group is considered medium risk if both CPU and memory saturation are > 0 but < 50% and there are no memory limit events or restarts.

The node group is considered high risk if both CPU and memory saturation are > 50%;
Or the balance ratio is ≥ 10;
Or memory limit events or restarts have occurred.
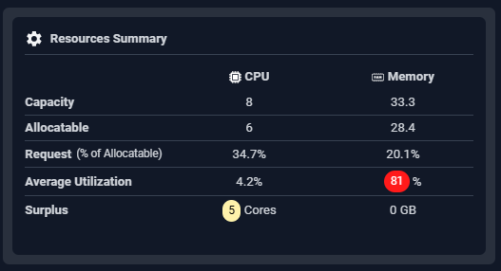
Resource Summary
Utilization Charts
The last section provides utilization charts that show hourly min/max and sustained activity for the selected node group. You can also expand any chart to the modal view and select other views. See Analysis Details Table for details on using these charts to review workload data.- CPU Utilization (%)
- Actual Memory Utilization (%)
- No. Of Nodes
- Memory Utilization (%)
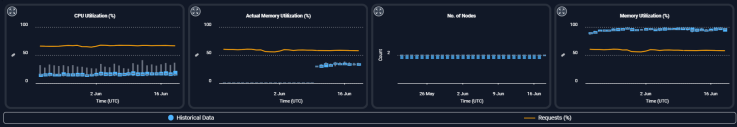
Figure: Utilization Charts
Video Resources
Using the Tree Viewer
Using the Tree Viewer
Using the Utilization Charts
Using the Utilization Charts