Figure: Locating the Analysis Details Tab
Figure: Locating the Analysis Details Tab
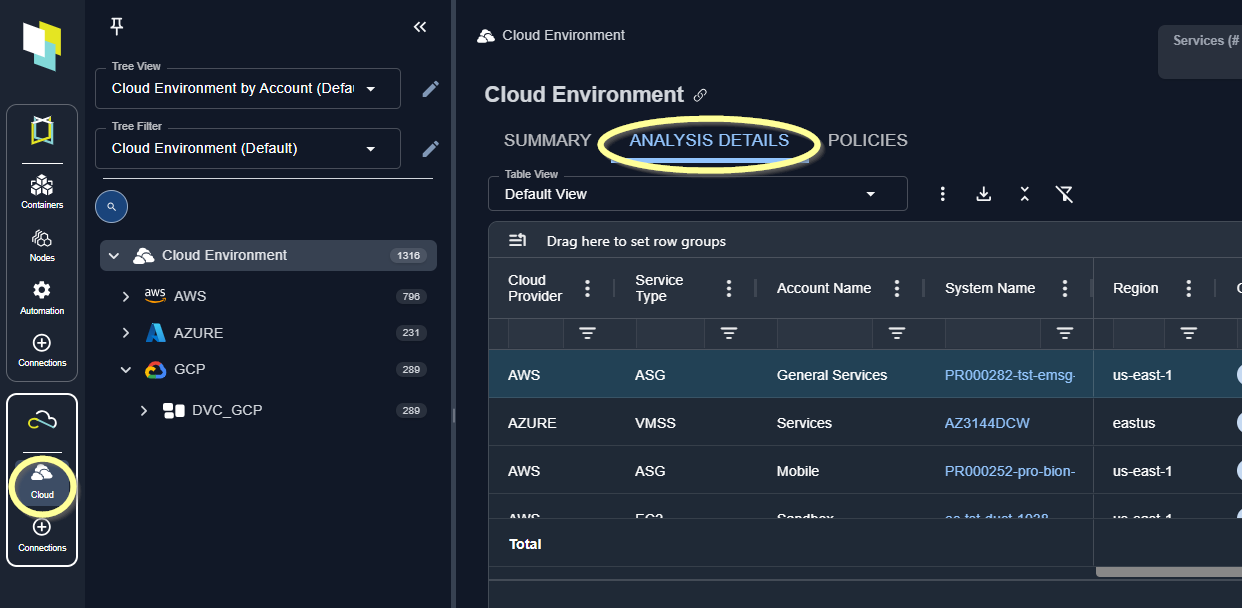
- A tabular report—A configurable tabular report is shown in the top pane. Descriptions of each column are provided in Analysis Details Table tabular data.
- Utilization Charts—Based on the system selected in the top pane, the corresponding utilization charts are shown in the lower pane. See Analysis Details Utilization Charts for details on expanding, configuring and interpreting the utilization charts
Note: Systems that do not have adequate collected data for recommendation analysis are not included on this page.
Searching for Systems
You can search the table for a specific system or set of systems.- Enter your search criteria in the search bar, located in the upper right of the page.
- The table contents update as you enter your search parameters.
- Click the X in the search box to clear the search parameters.
Column Filters
You can apply various filters to customize the scope of containers or cloud instance you are reviewing in the table. See Using Filters.Exporting Data
You can export tabular reports from this tab to Microsoft® Excel.- Select the table view and adjust views and filters to obtain the desired set of data.
- Click the export icon, located beside the Table View drop down menu.
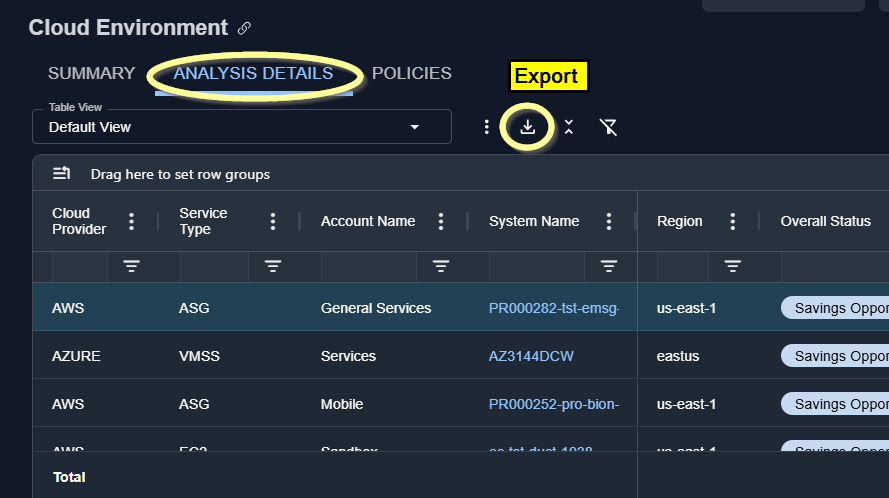
Figure: Export Button
Table Views
A number of pre-configured views enable you to see analysis results that are applicable to your specific use case. Each pre-defined view has only the applicable columns enabled and filters have been set to include only systems that meet certain criteria. Details of all pre-configured views are provided in Analysis Details Table.Video Resources
Searching for a System
Searching for a System
Setting Filters in Columns
Setting Filters in Columns
Using the Tree Viewer
Using the Tree Viewer
Using the Utilization Charts
Using the Utilization Charts